Managing spatial omics datasets with SpatialData & LaminDB  
- Lukas Heumos, Altana Namsaraeva, Tim Treis, Mark Keller, Wouter-Michiel Vierdag, Luca Marconato, Lea Zimmermann, Sunny Sun, Alex Wolf
Spatial omics technologies — Xenium, Visium, MERFISH, seqFISH, and others — are generating datasets that combine molecular profiling with spatial coordinates.
The SpatialData framework[1] provides a unified format for these heterogeneous datasets: images, segmentation masks, point clouds, shapes, and count tables, all stored in a single .zarr store.
But as spatial datasets accumulate across experiments and technologies, managing, querying, and training models on them becomes a major challenge.
To address this, we have built native SpatialData support into LaminDB, enabling cross-dataset queries, dataset validation, and lineage tracking.
Querying spatial datasets by biological metadata
Every SpatialData object in LaminDB is a queryable Artifact annotated with biological & operational metadata.
This means you can query datasets by any feature and entity you care about without relying on brittle file paths and folder structures. For example, this queries two features assay and disease:
import lamindb as ln

db = ln.DB("laminlabs/lamindata")

xenium_datasets = db.Artifact.filter(
    db.Feature.get(name="assay") == "Xenium Spatial Gene Expression",
    db.Feature.get(name="disease") == "ductal breast carcinoma in situ",
)
xenium_datasets.to_dataframe()
import lamindb as ln
import bionty as bt

db = ln.DB("laminlabs/lamindata")

xenium_datasets = db.Artifact.filter(
    db.Feature.get(name="assay") == db.bionty.ExperimentalFactor.get(name="Xenium Spatial Gene Expression"),
    db.Feature.get(name="disease") == db.bionty.Disease.get(name="ductal breast carcinoma in situ"),
)
xenium_datasets.to_dataframe()
It returns a dataframe of all Xenium datasets in the laminlabs/lamindata database that characterize breast carcinoma.
Understanding the context of a dataset
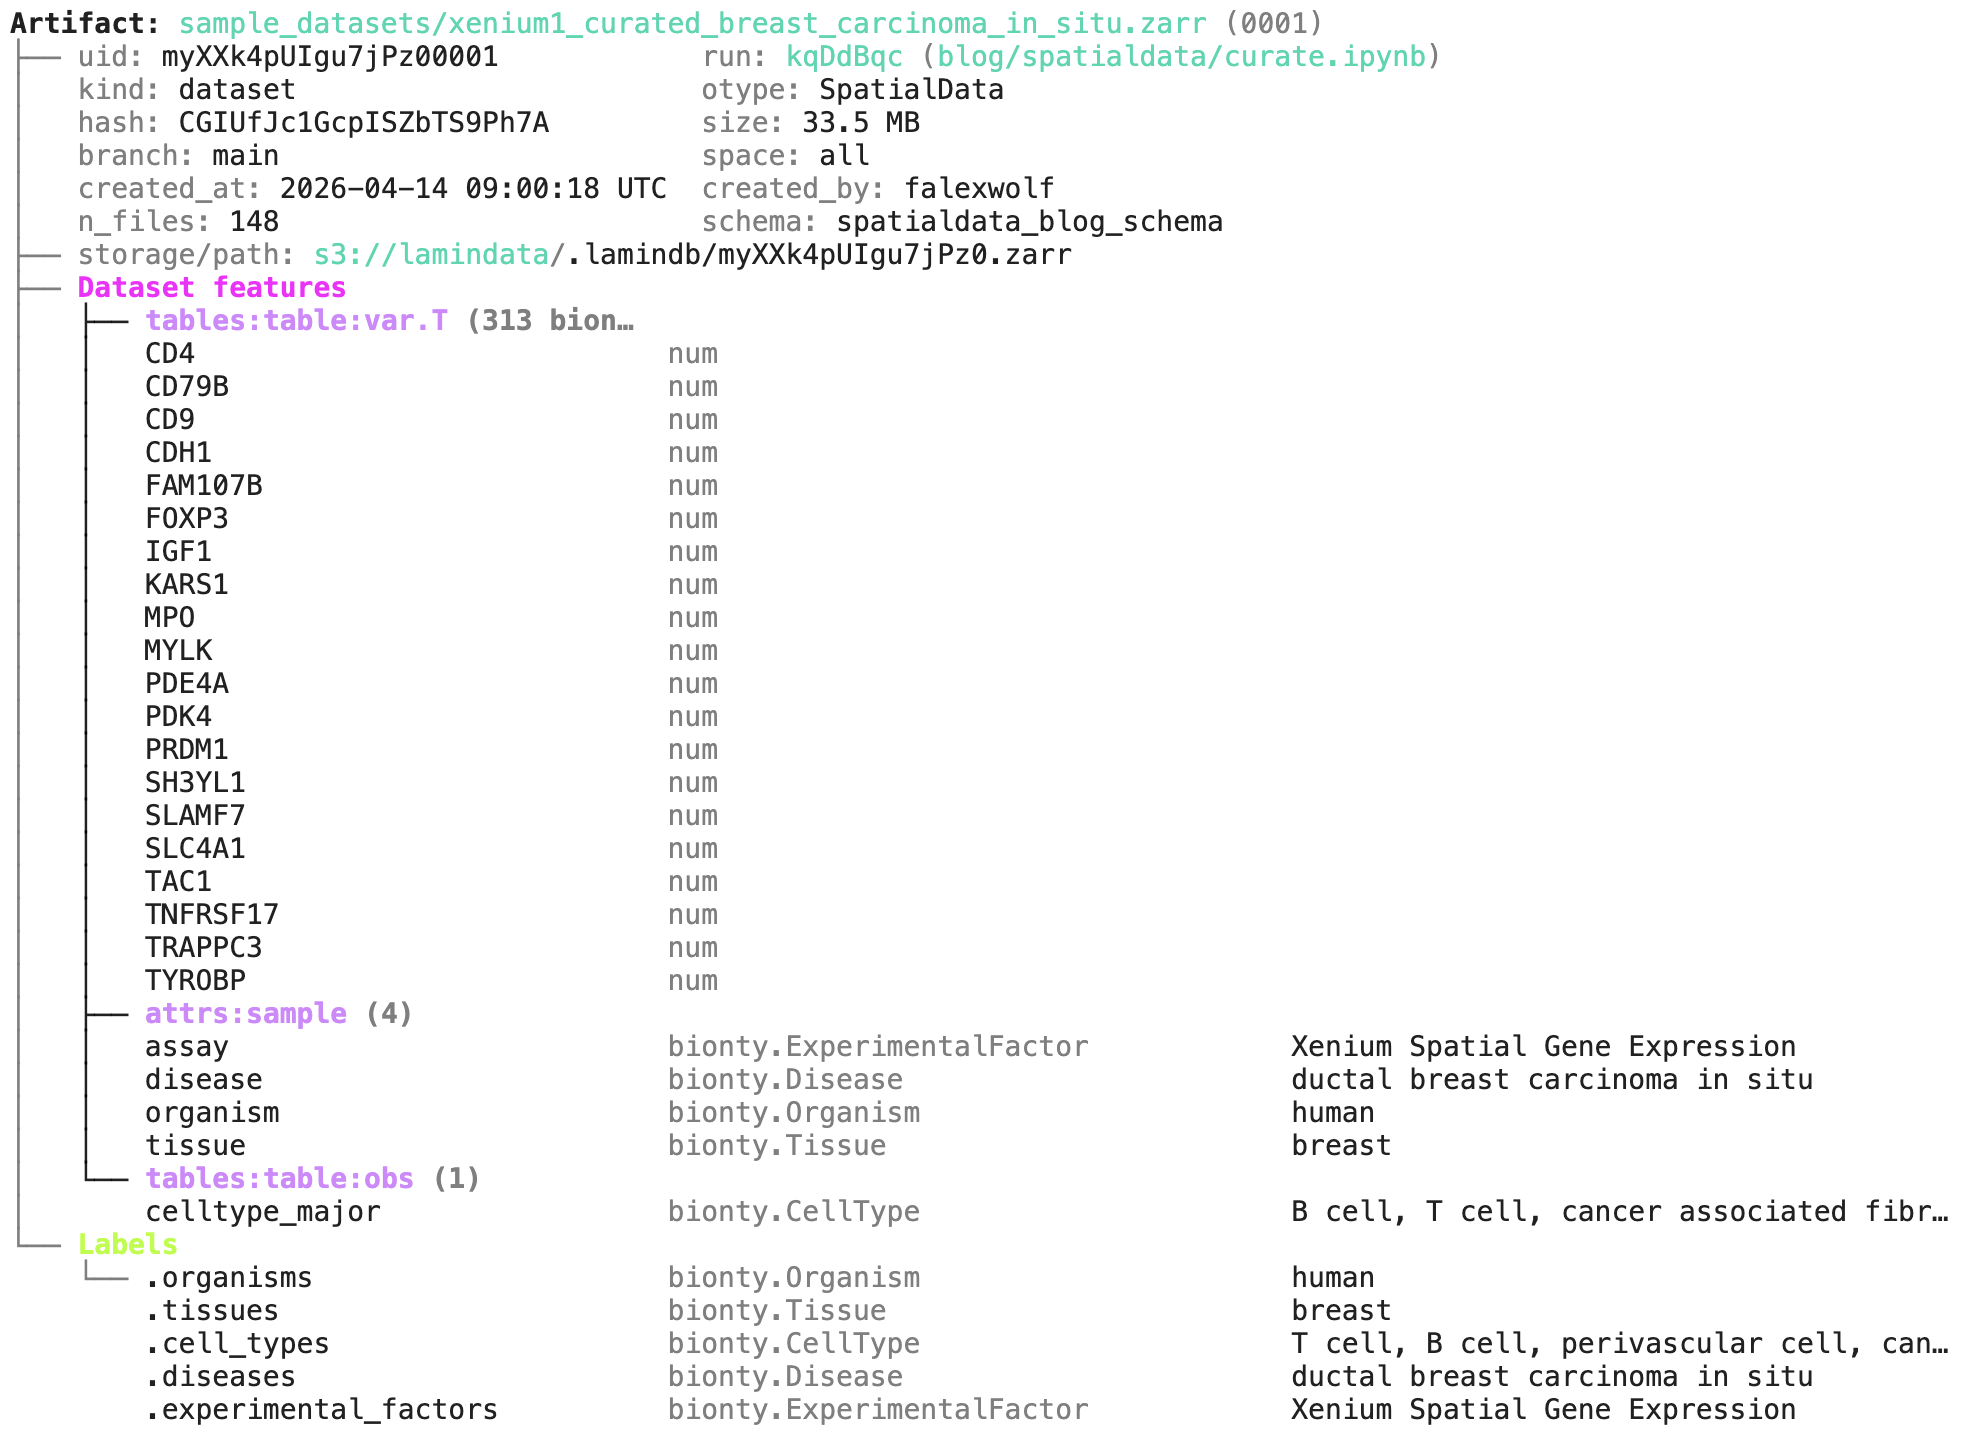
Let us pick the first dataset in the results and call .describe():
artifact = xenium_datasets[0]
artifact.describe()
We can see all metadata, including the notebook that created the dataset blog/spatialdata/curate.ipynb:
Loading and analyzing spatial data
Loading the artifact into a SpatialData object backed by a local cache is one line:
sdata = artifact.load()
It looks like:
SpatialData object, with associated Zarr store: /Users/falexwolf/Library/Caches/lamindb/lamindata/sample_datasets/xenium1_curated_breast_carcinoma_in_situ.zarr
├── Images
│     ├── 'morphology_focus': DataTree[cyx] (1, 2310, 3027), (1, 1155, 1514), (1, 578, 757), (1, 288, 379), (1, 145, 189)
│     └── 'morphology_mip': DataTree[cyx] (1, 2310, 3027), (1, 1155, 1514), (1, 578, 757), (1, 288, 379), (1, 145, 189)
├── Points
│     └── 'transcripts': DataFrame with shape: (<Delayed>, 8) (3D points)
├── Shapes
│     ├── 'cell_boundaries': GeoDataFrame shape: (1899, 1) (2D shapes)
│     └── 'cell_circles': GeoDataFrame shape: (1812, 2) (2D shapes)
└── Tables
      └── 'table': AnnData (1812, 313)
with coordinate systems:
    ▸ 'aligned', with elements:
        morphology_focus (Images), morphology_mip (Images), transcripts (Points), cell_boundaries (Shapes), cell_circles (Shapes)
    ▸ 'global', with elements:
        morphology_focus (Images), morphology_mip (Images), transcripts (Points), cell_boundaries (Shapes), cell_circles (Shapes)
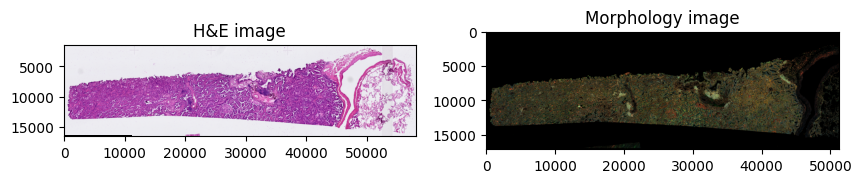
The resulting object integrates with the scverse ecosystem.
For instance, one can visualize H&E images and segmentation masks with spatialdata-plot,[2] run spatial analyses with squidpy, apply standard scanpy workflows to the count matrix in sdata.tables["table"], and use any other scverse ecosystem package.
import spatialdata_plot

axes = plt.subplots(1, 2, figsize=(10, 10))[1].flatten()
sdata.pl.render_images("he_image", scale="scale4").pl.show(
    ax=axes[0], title="H&E image"
)
sdata.pl.render_images("morphology_focus", scale="scale4").pl.show(
    ax=axes[1], title="Morphology image"
)
The AnnData table embedded in SpatialData stores the expression matrix alongside cell-level annotations:
sdata.tables["table"]
gives us:
AnnData object with n_obs × n_vars = 1812 × 313
    obs: 'cell_id', 'transcript_counts', 'control_probe_counts', 'control_codeword_counts', 'total_counts', 'cell_area', 'nucleus_area', 'region', 'dataset', 'celltype_major', 'celltype_minor'
    var: 'symbols', 'feature_types', 'genome'
    uns: 'spatialdata_attrs'
    obsm: 'spatial'
Validating SpatialData objects
While you can store any .zarr folder in LaminDB using the standard Artifact constructor, some workflows require stricter data integrity.
To enforce this, LaminDB provides from_spatialdata() — a specialized constructor that validates the object against a Schema.
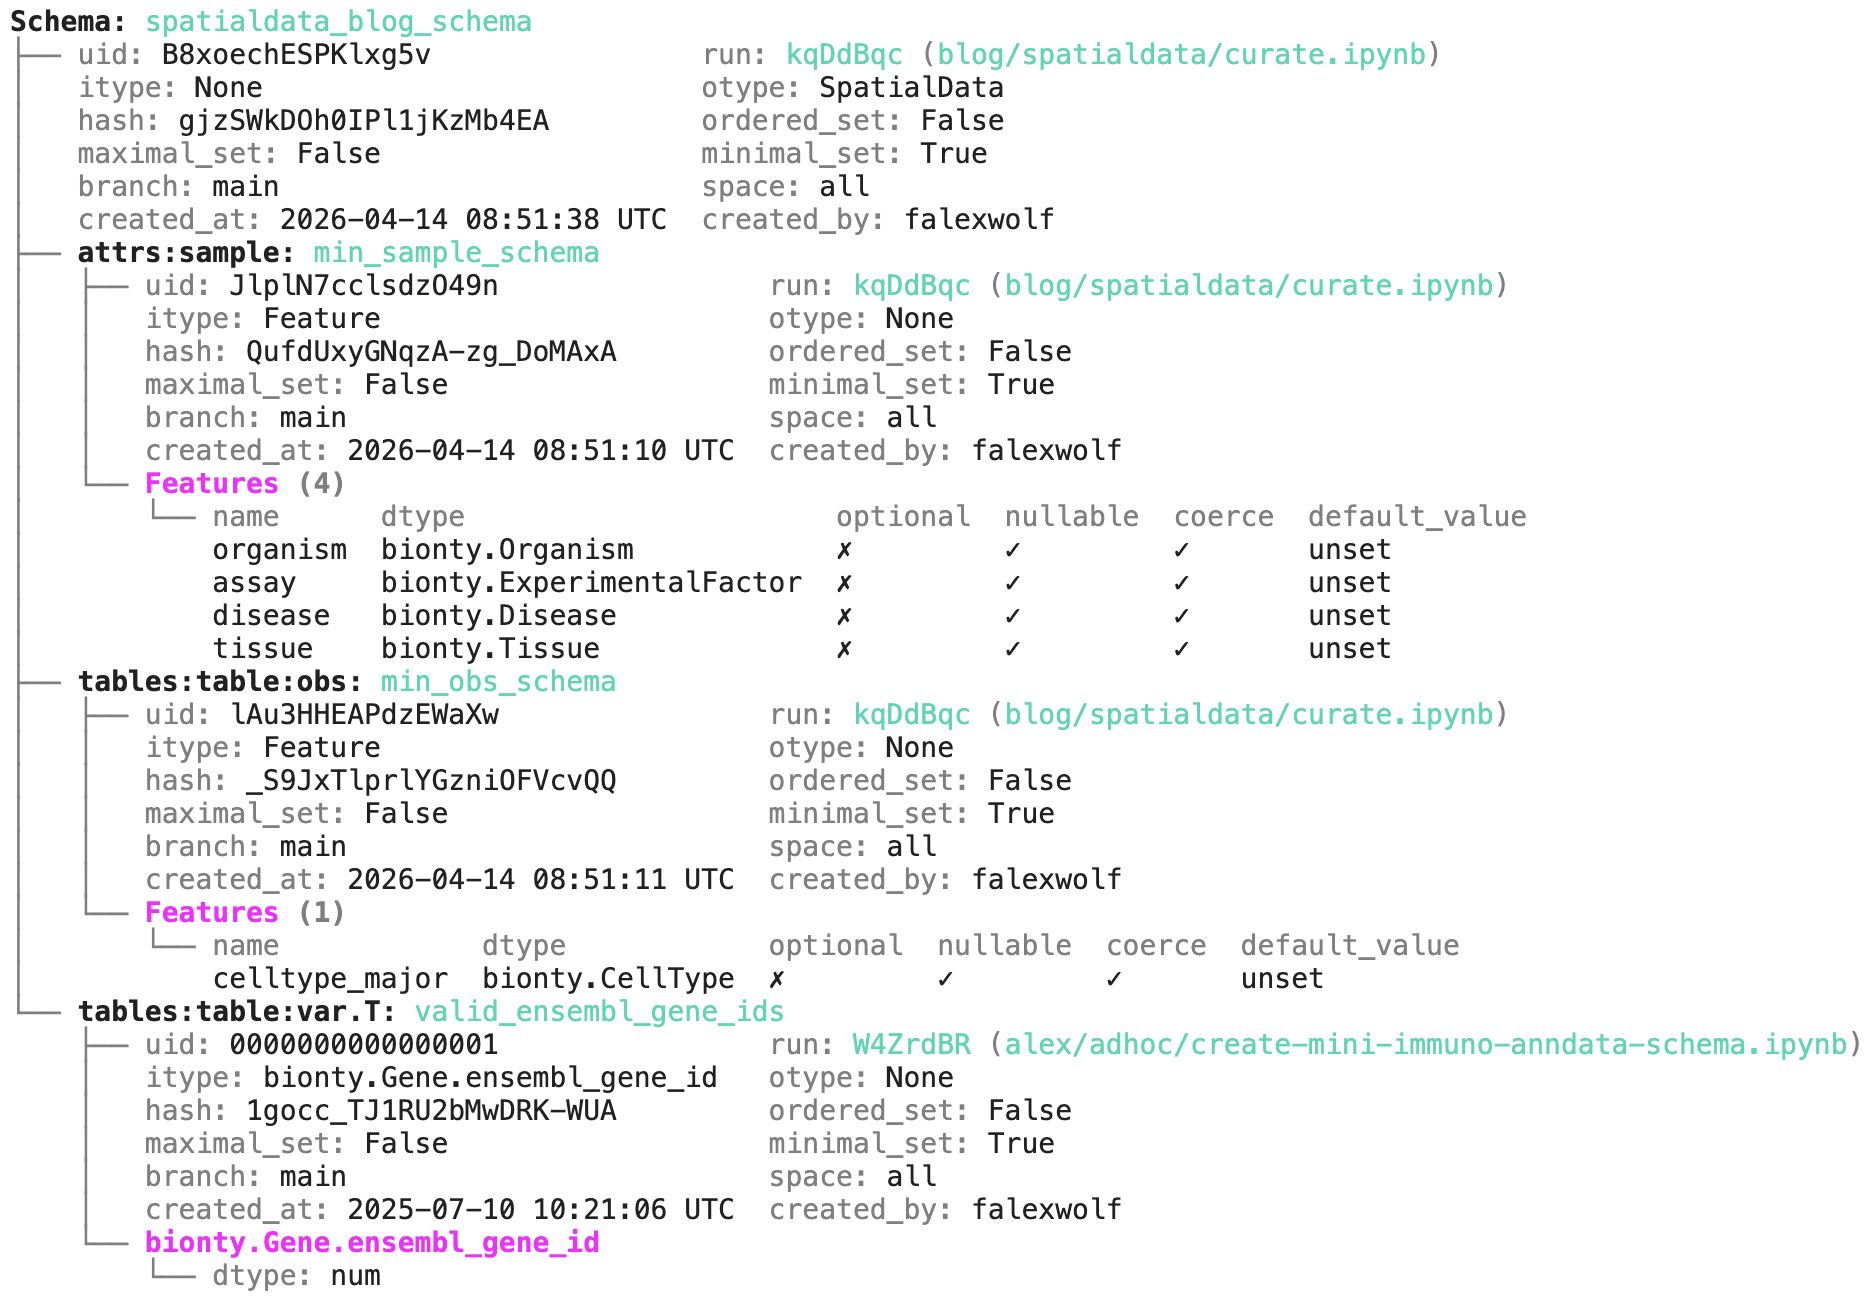
Because SpatialData objects are highly compositional, the Schema object allows you to define validation rules for specific components. Let’s inspect an example schema:
schema = db.Schema.get(name="spatialdata_blog_schema")
schema.describe()
The output reveals the expected components of the SpatialData object, where validation rules are expressed as features and their corresponding data types, based on the pandera validation library:
Beyond standard validation through pandera, the schema validates metadata against ontology-backed registries — ensuring gene IDs, cell types, diseases, and assays are standardized before a dataset gets ingested. The ingestion then looks like this:
artifact = ln.Artifact.from_spatialdata(
    sdata,
    key="xenium/my_experiment.zarr",
    schema=schema,
).save()
Under the hood, this leverages the SpatialDataCurator class, which offers helpers for standardization in addition to validation.
Because validation is a verifiable task and SpatialDataCurator provides clear feedback, agents excel at working with it.
For a deeper dive into the richer curation API, see the curation guide.
Interactive visualization with Vitessce
LaminDB integrates with Vitessce for interactive spatial visualization directly on LaminHub in your browser. After saving a SpatialData artifact, you can configure a Vitessce dashboard and attach it:
from vitessce import VitessceConfig, SpatialDataWrapper

vc = VitessceConfig(schema_version="1.0.18")
dataset = vc.add_dataset(name="lung").add_object(
    SpatialDataWrapper(sdata_artifact=artifact, ...)
)
# ... configure views ...

ln.integrations.save_vitessce_config(vc)
Once saved, a Vitessce button appears next to the artifact on LaminHub, enabling collaborators to explore the dataset interactively:
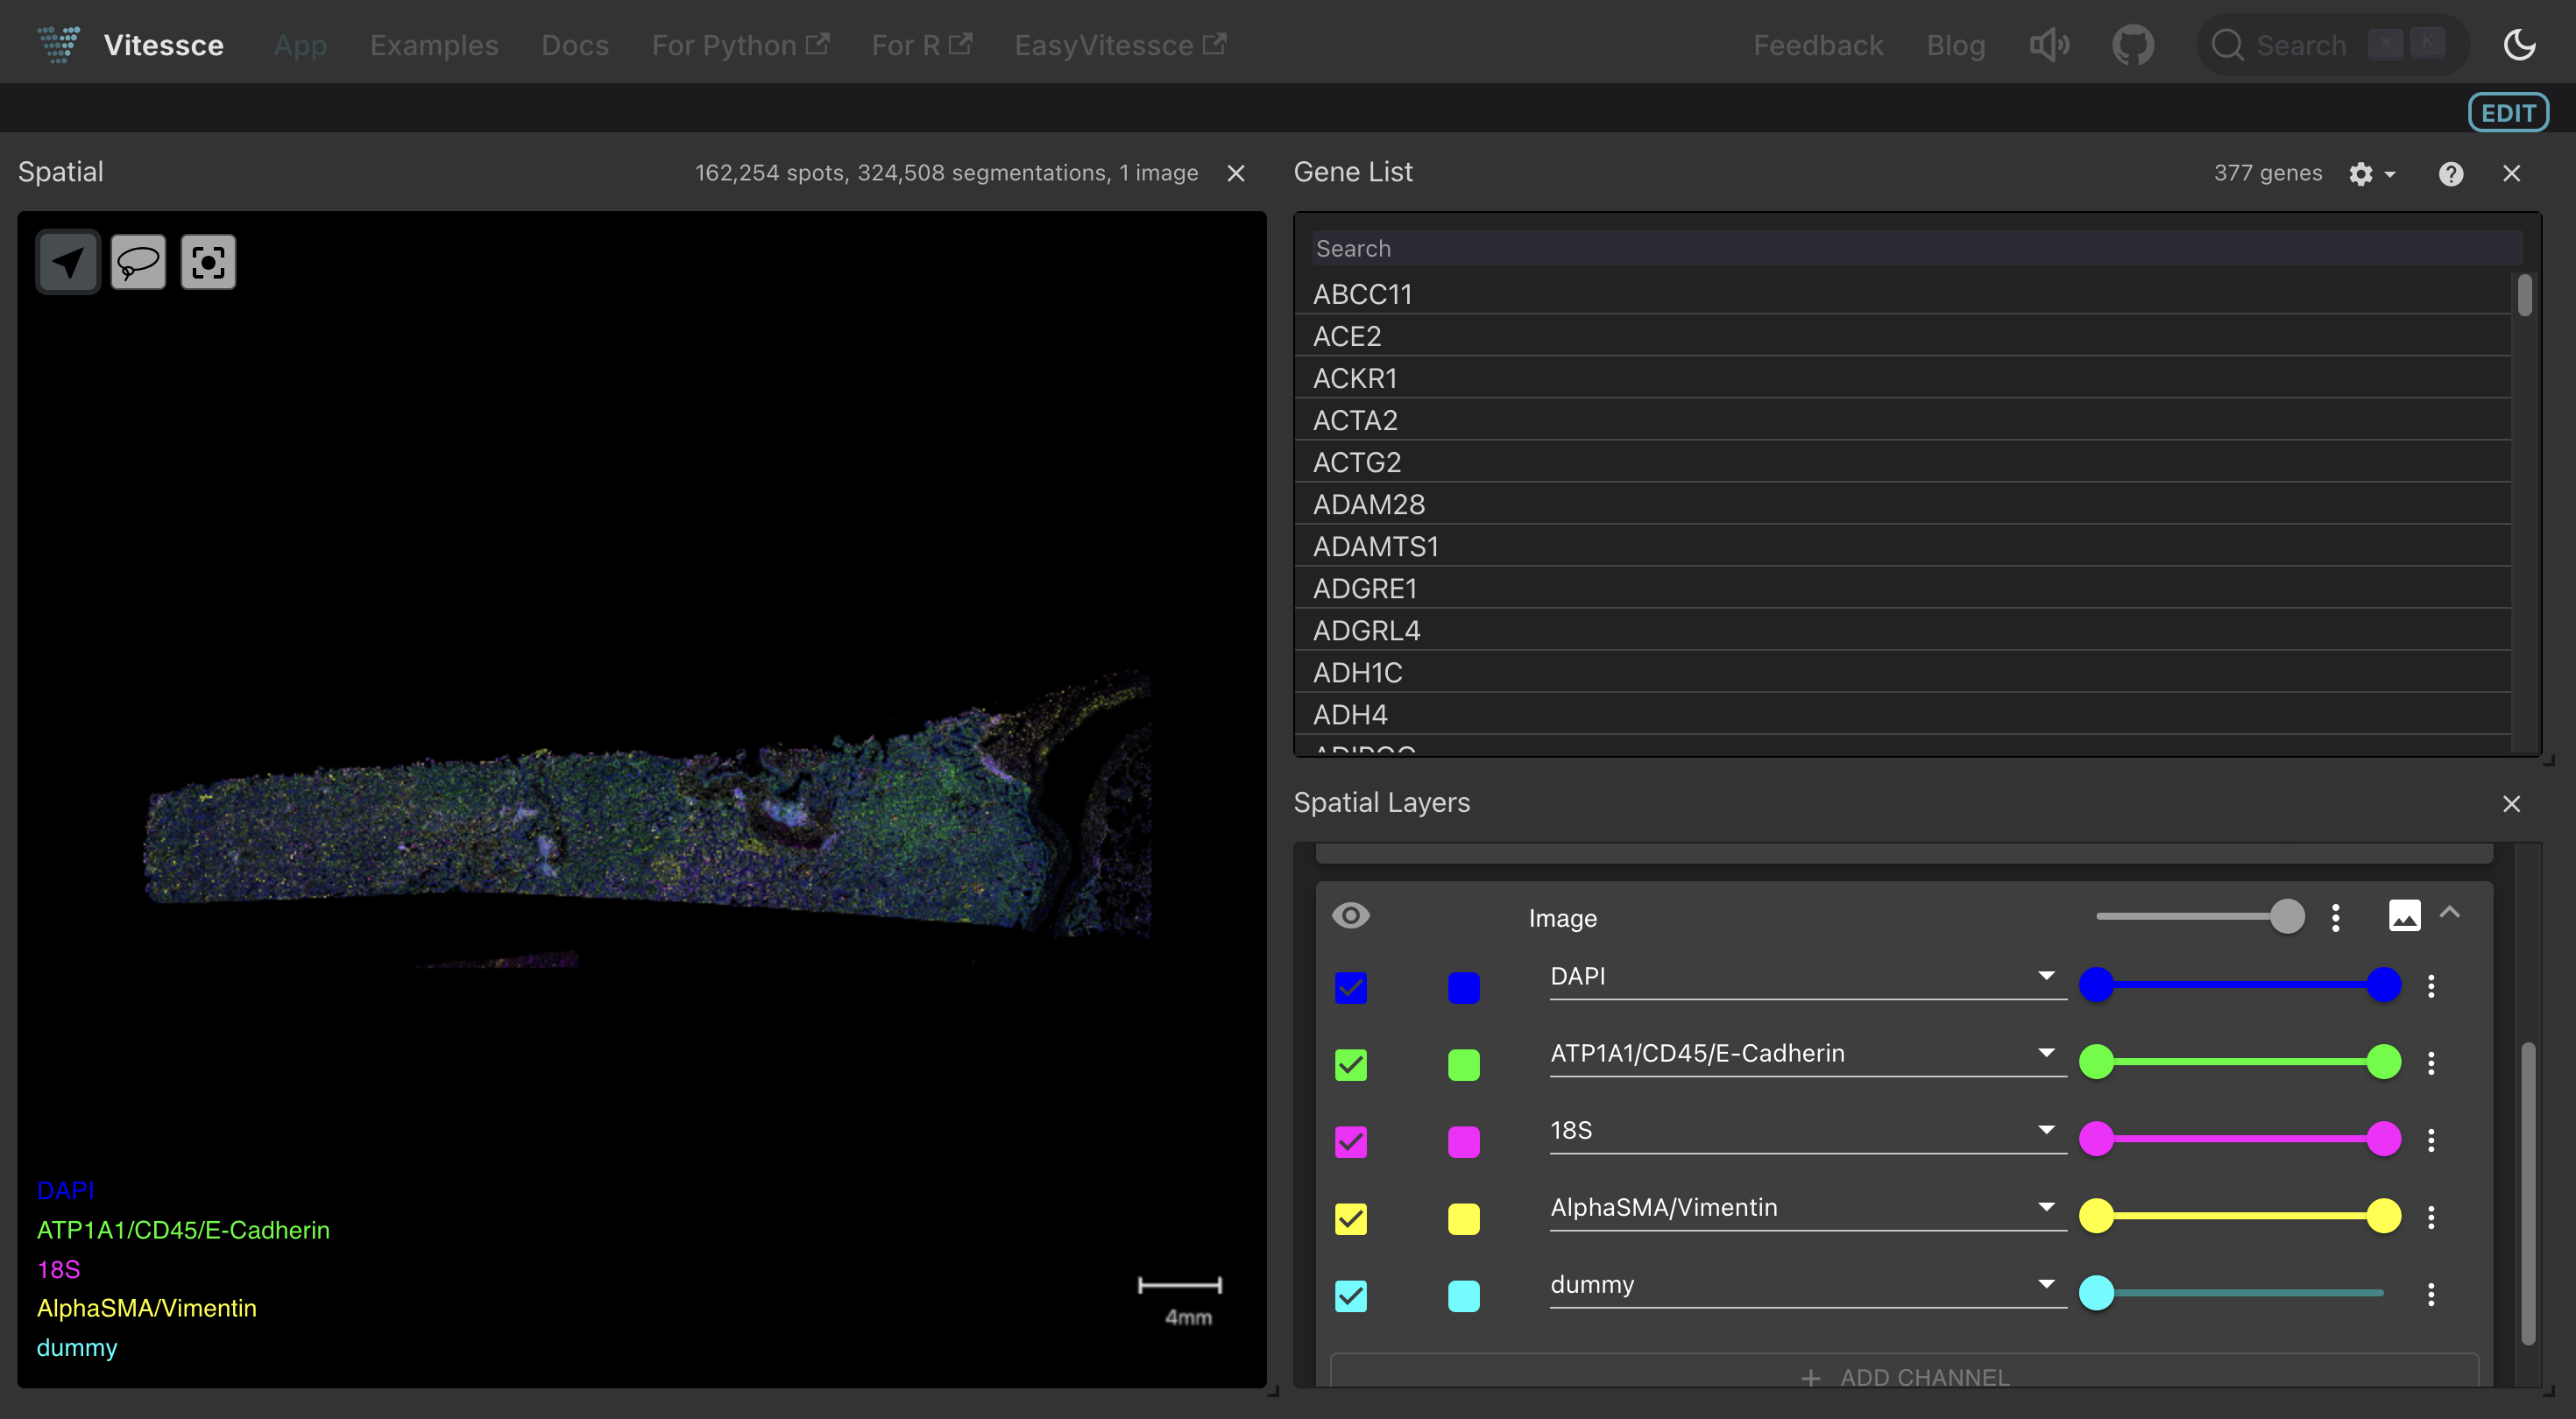
You can explore such a dashboard here. For a full walkthrough, see the Vitessce: SpatialData guide.
Training ML models on spatial data
SpatialData’s ImageTilesDataset creates a PyTorch-compatible dataset by tiling images around spatial coordinates.
Combined with LaminDB’s artifact tracking, you get a complete lineage from raw spatial data through tiled training sets to model checkpoints.
from spatialdata.dataloader.datasets import ImageTilesDataset

tiles_dataset = ImageTilesDataset(
    sdata=sdata,
    regions_to_images={"cell_circles": "he_image"},
    regions_to_coordinate_systems={"cell_circles": "global"},
    tile_dim_in_units=128,
    tile_scale=1.0,
)
This dataset plugs directly into PyTorch Lightning for training spatial models — for example, cell type classifiers using DenseNet on image tiles. See the spatial ML guide for a full example.
Acknowledgements: scverse
We are grateful to collaborate with scverse — not only on interoperability, but also on supporting a curated collection of public SpatialData datasets at scverse/spatialdata-db.
This database is a work in progress but already today provides validated ready-to-query spatial datasets — useful for benchmarking, method development, model training, and as a reference atlas.
Code & data availability
The
spatialdatasource code: github.com/scverse/spatialdataThe
lamindbsoure code includingfrom_spatialdata()andSpatialDataCurator: github.com/laminlabs/lamindbThe code snippets & figures of this post: lamin.ai/laminlabs/lamindata/transform/PqAYAQzVm8ml
Spatial guide: docs.lamin.ai/spatial
Vitessce integration: docs.lamin.ai/vitessce2 & blog.lamin.ai/vitessce
Curate & ingest guide: docs.lamin.ai/spatial3
Spatial ML training: docs.lamin.ai/spatial4
Public spatial datasets: lamin.ai/scverse/spatialdata-db
Citation
Heumos L, Namsaraeva A, Treis T, Keller M, Vierdag WM, Marconato L, Zimmermann L, Sunny S & Wolf A (2026). Managing spatial omics datasets with SpatialData & LaminDB. Lamin Blog.
https://blog.lamin.ai/spatialdata