Interactive visualization of multimodal and spatial data with Vitessce  
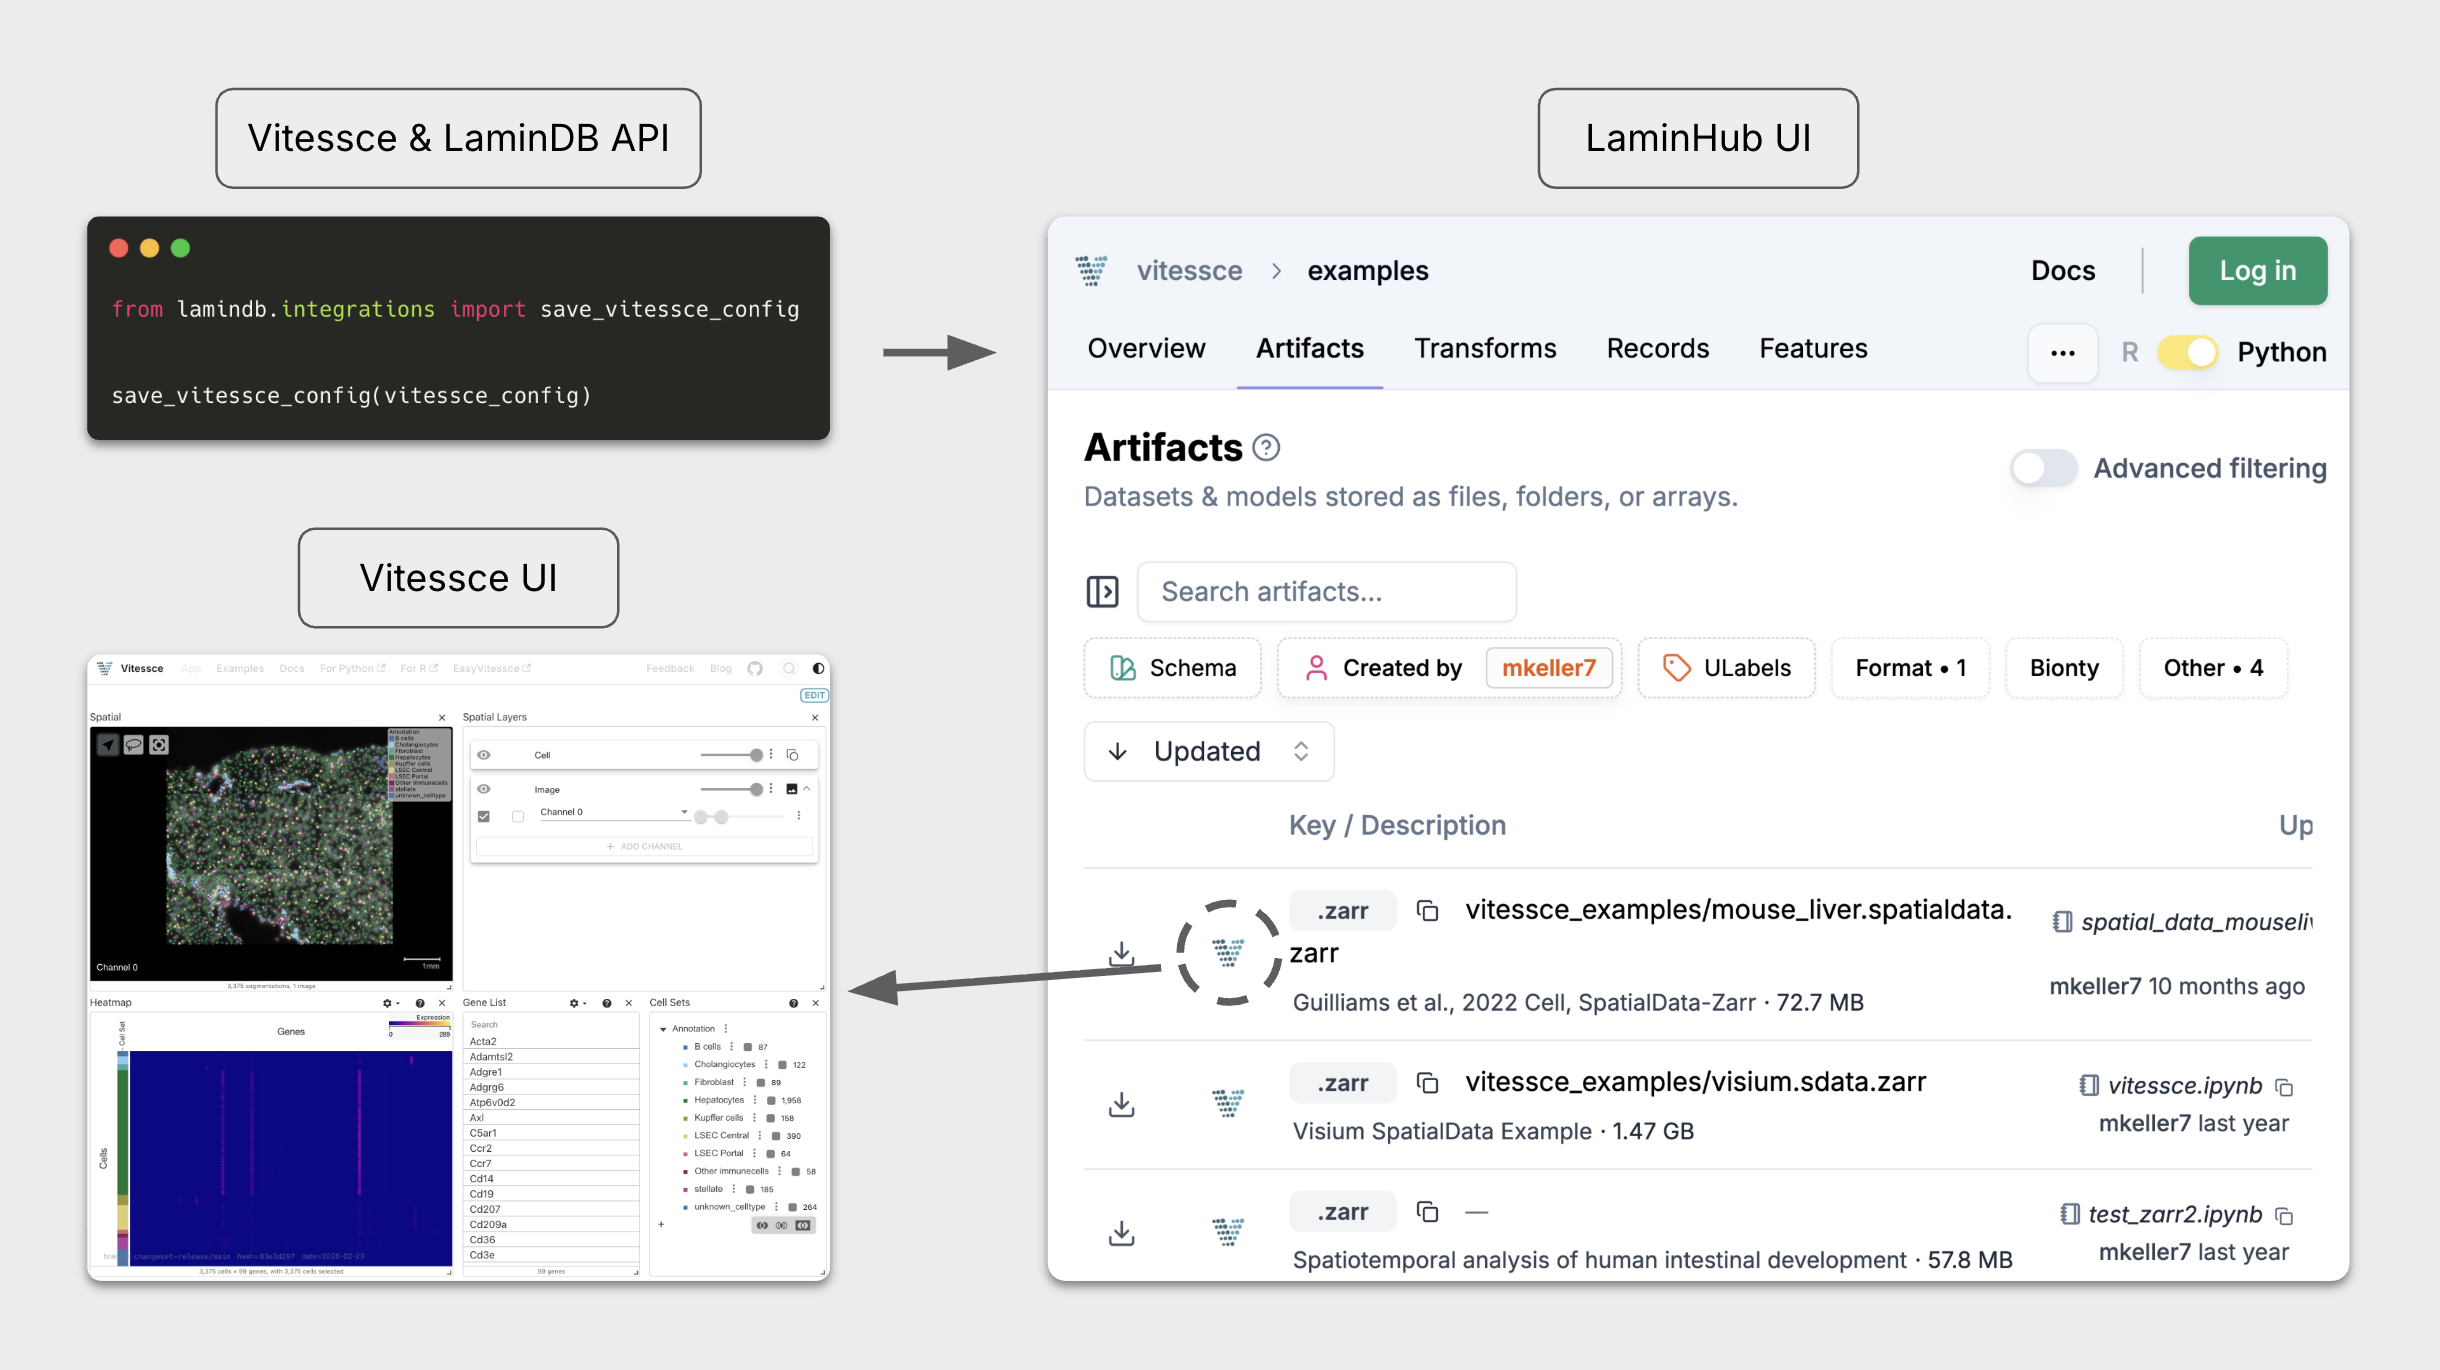
The open-source tool Vitessce and Lamin now work together to manage & visualize multimodal and spatial single-cell data. It’s simple: define a Vitessce config in code, save it as an artifact, and share the interactive visualization along with your datasets on LaminHub.
Vitessce
Single-cell experiments result in heterogeneous datasets due to several factors: differing profiling techniques (e.g., sequencing-based versus imaging-based), platforms, modalities (e.g., transcriptomics, epigenomics, proteomics, and combinations thereof), and scales (e.g., spot to single-cell to subcellular). Data pipelines often add cell type annotations or cell segmentations together with embeddings and other types of information. Visualizing the rich information in these complex datasets helps scientists interpret key features, whether they are biologists looking to answer biological questions or machine learning engineers trying to understand behaviors of outlier datasets.
Vitessce[1] is an open-source JavaScript-based framework for interactive visualization of multimodal and spatial single-cell data. Its dashboard-like views can easily be defined programmatically and then serialized as a JSON artifact. Vitessce then runs serverless anywhere against common storage backends like AWS S3. Specifically, it was designed around the following goals:
Tailor visualizations to problem-specific data and biological questions.
Integrate and explore multimodal data with multiple coordinated views triggered, e.g. by selecting a gene, a cell type, or a visual property such as a colormap.
Deploy and share interactive visualizations.
Access data from different storage formats. Data can be loaded from multiple storage formats, including the scverse
AnnData,MuData, andSpatialDataformats and the Open Microscopy Environment OME-TIFF and OME-Zarr formats.Platform-independence: Being implemented in JavaScript and WebGL, the framework can be used not only in websites as a React component, but also in Python as a Jupyter widget or in R in the RStudio Viewer pane, in pkgdown websites, or as a Shiny widget.
Integration with LaminDB
Managing the URL paths to local and cloud object storage systems manually becomes cumbersome in particular when managing a high number of datasets.
Through the integration with LaminDB, the vitessce Python module now supports building configurations directly based on LaminDB artifacts, which are tracked, validated, and queryable and let the user focus on the entities they care about – genes, experiments, cell types, samples, etc. – rather than storage paths.
The way this works is by passing Artifact objects to _artifact-suffixed arguments, for example, for AnnData, via the adata_artifact argument in Vitessce’s AnnDataWrapper, or for OME-TIFF via the img_artifact argument in ImageOmeTiffWrapper.
Supported formats
Vitessce supports multiple scverse data formats, including AnnData, MuData, and SpatialData, as well as the bioimaging formats OME-TIFF and OME-Zarr.
SpatialData[2] is the most recent of these formats, and acts as a container object for multiple spatial elements: Tables, Points, Shapes, Labels, and Images.
While individual elements within a SpatialData object can be stored using multiple separate formats (e.g., AnnData for Tables; OME-TIFF for Images), usage of SpatialData enables storing metadata such as coordinate systems and transformations in a single place. It hence facilitates operations such as spatial queries that involve table columns or rapid conversion between vector- and raster-based representations.
Example & guides
You’ll find simple guides for visualizing AnnData, SpatialData, OME-ZARR and OME-TIFF at docs.lamin.ai/vitessce.
In this rich example notebook, you’ll find a complex example for a SpatialData object that includes visualizing individual Spatial Elements using alternative formats, all tracked & managed with LaminDB.
Acknowledgements
Vitessce is developed by the Humans in Data Integration, Visualization, and Exploration (HIDIVE) Lab at Harvard Medical School. The HIDIVE Lab aims to address challenges in visualization and exploration of biomedical data.
Lamin started first working on the integration because the need was surfaced by Tim Treis & Lukas Heumos. We’re grateful for that!
Appendix
There are three main ways that a Vitessce visualization can be customized: data, views, and coordinations. Useful starting points for customization include the following example database and related resources:
The vitessce/examples database
The vitessce-python-tutorial repository
The paper-figures repository