- Database
- ⸻ 2026-09-07
Extracting single-cell morphology and subcellular protein localisation from Xenium data with scPortrait  

Spatial transcriptomics measures RNA abundance and spatial localization in tissue and is routinely complemented by fluorescence microscopy imaging. Here, we show how to extract single-cell images from this data with the Python-based toolkit scPortrait. We then embed the single-cell images with a neural network to identify cells with distinct morphologies and intracellular protein distributions. We further characterize these cells by inspecting their gene expression, finding a morphologically defined subpopulation that expresses the collagen gene COL5A1.
We study a publicly available Xenium dataset from an ovarian cancer patient.[1] This dataset includes more than 120 million transcripts from more than 400,000 cells, along with fluorescence images showing staining of multiple cellular structures and proteins, including the cell membrane and nucleus.
We will extract and analyze single-cell images from this dataset using scPortrait.[2] Our workflow consists of:
Loading the Xenium dataset as a SpatialData[3] object
Loading the immunohistochemistry images into scPortrait
Using the cytosol segmentation provided as part of the dataset to extract single-cell images with scPortrait
Deriving single-cell image features with the convolutional neural network ConvNeXt[4] pretrained on natural images
Loading Xenium Data
After loading the Xenium dataset into a SpatialData object we can inspect the tissue sample that was profiled (Figure 1).
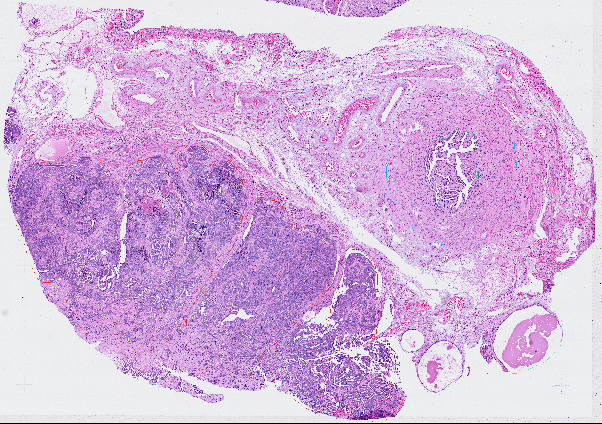
Figure 1 (source): H&E staining of the 10x Genomics Xenium ovarian cancer tissue sample.
Zooming in further, we can see that the different fluorescence microscopy imaging channels capture different aspects of cellular composition that allow us to differentiate between cells in the tissue (Figure 2). The stained structures are summarized in Table 1.
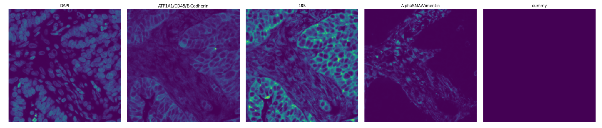
Figure 2 (source): Fluorescence microscopy images of different proteins and subcellular structures in a small region of the ovarian cancer Xenium dataset.
Channel |
Stain |
Description |
|---|---|---|
1 |
DAPI |
DNA |
2 |
ATP1A1, E-Cadherin, CD45 |
ATP1A1, E-Cadherin: Epithelial markers |
3 |
18S |
Ribosomal RNA, used for segmentation |
4 |
AlphaSMA/Vimentin |
AlphaSMA: Smooth Muscle Actin, a cytoskeletal protein |
5 |
None |
Dummy Channel |
Table 1: Summary of the fluorescent stains used in the ovarian cancer Xenium dataset.
Extracting single-cell images
To generate a single-cell image dataset we apply a segmentation mask to the image, and then extract images of individual cells. The Xenium dataset provides a segmentation mask already (Figure 3).
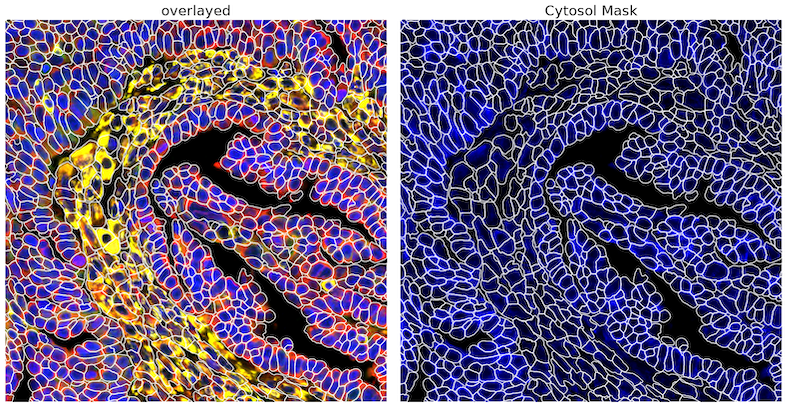
Figure 3 (source): Segmentation masks from the ovarian cancer Xenium dataset loaded into scPortrait.
After loading the sdata object into an scPortrait project, we can run scPortrait.extract() to extract a single-cell image dataset (Figure 4).
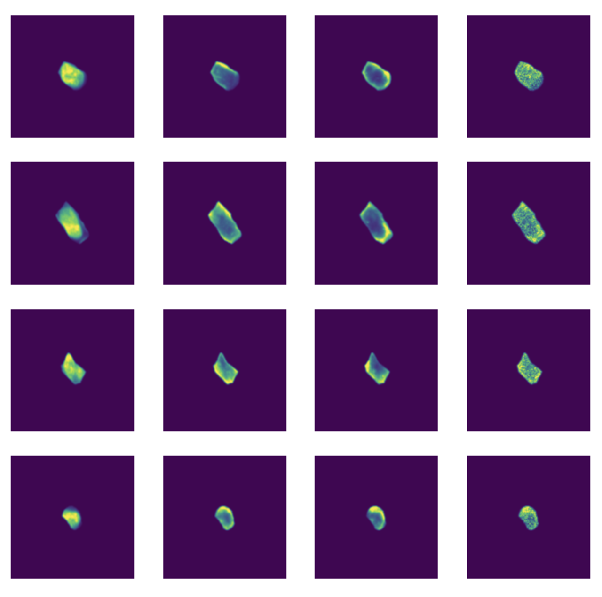
Figure 4 (source): Single-cell images from the ovarian cancer Xenium dataset extracted with scPortrait.
Embedding single-cell images
To find similarities and differences between individual cells in our image dataset, and to ultimately integrate different single-cell datasets and modalities, we have to embed all cells into a unified representation. To do this, we first have to derive common features describing each cell based on its image. Multiple approaches to achieve this have been described, which broadly fall into two categories:
Using pre-engineered ways to calculate single-cell image features, such as using the convex hull of the DAPI stain to calculate a nucleus outline and area. CellProfiler[5][6] provides a collection of such features.
Using automatic feature extractors that learn descriptive features from image data. This is currently done using deep learning with models based on architectures including convolutional neural networks (CNNs) and vision transformers (ViTs).
Here, we use ConvNeXt,[4] a CNN that was trained to classify images in imageNet,[7] a collection of natural images. We hypothesize that ConvNeXt has learned a feature set that is useful to describe images, and can therefore identify cellular phenotypes despite not having been trained on images of cells. The images in imageNet are 3-channel RGB images. Hence, ConvNeXt accepts three input channels. We chose to use the ATP1A1, E-Cadherin, CD45 (#2), 18S (#3) and AlphaSMA/Vimentin (#4) channels to featurize our cells. Using scPortrait, we can then calculate ConvNeXt features for all cells in the Xenium dataset. Using UMAP to inspect this embedding, we find populations of cells corresponding to different morphologies and intracellular marker protein distributions.
Overlaying this image-based embedding with transcriptome information for each cell reveals that cellular differences identified via image-based features are accompanied by gene expression changes. For example, we identify a morphologically distinct population of cells that expresses the collagen gene COL5A1 (Figure 5).
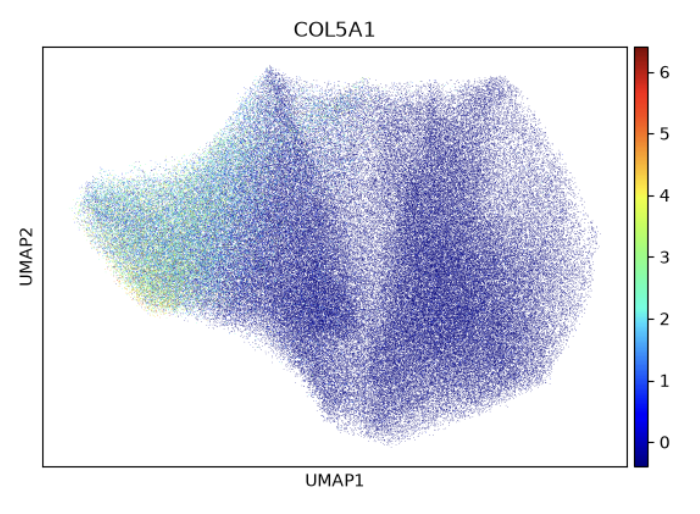
Figure 5 (source): UMAP representation of ConvNeXt image features of individual segmented cells in an ovarian cancer tissue region. Each dot corresponds to a single cell. Colors correspond to the expression of the COL5A1 gene across cells. COL5A1 was identified as a gene with variable expression across image-based cell embeddings by calculating differentially expressed genes across Leiden clusters in image-space.
Data & code availability
The blog post roughly follows this guide for working with scportrait and lamindb: docs.lamin.ai/sc-imaging. For source code, see:
Analyses of this blog post: https://lamin.ai/scportrait/examples
The scPortrait library: MannLabs/scPortrait
Acknowledgements
We thank Lukas Heumos for support in creating docs.lamin.ai/sc-imaging.
How to cite
Mädler SC & Schmacke NA (2026). Extracting single-cell morphology and subcellular protein localisation from Xenium data with scPortrait. Lamin Blog. https://blog.lamin.ai/scportrait